Microstructure deterioration of fly ash-slag geopolymer exposed to marine splash
Under the deterioration in the marine environment, the durability of offshore concrete structures has become one of the most significant concerns in marine resource development [1]. The corrosive ions in seawater and complex marine environment initiate multifaceted chemical and physical deterioration in concrete, involving the corrosion of steel reinforcement, decomposition of cement hydration products, newly-formed expansive crystalline phases, and mechanical abrasion [2].
When chloride ions in seawater penetrate into the concrete, the ions migrate to the surface of the steel reinforcement to induce micro-corrosion cells and pitting damage [3]. The formation of corrosion products (mainly ferric hydroxide, Fe(OH)3) expands in volume, generates internal stress, and even causes cracking and structural failure in concrete. This is the primary mechanism for chloride-induced steel corrosion. Additionally, seawater also induces other chemical deterioration in cementitious binder through multiple pathways. The reaction between magnesium (Mg2+) ions from seawater and portlandite (Ca(OH)2) in the cement binder induces the formation of brucite [4]. This precipitation depletes the alkalinity of the pore solution, thereby destabilizing the calcium silicate hydrate (C-S-H) gel [5]. Consequently, the decalcified C-S-H undergoes a partial or complete conversion into non-cementitious magnesium silicate hydrate (M-S-H) gel [5, 6]. Although laboratory tests often report that the precipitation of brucite induces the formation of a superficial layer covered on the surface of cement binder, field investigations also reveal this precipitation is only occasionally identified within cracks developed in the binder [7, 8]. Sulfate ions present in seawater provoke deleterious sulfate attack, as characterized by the crystallization of expansive products like ettringite (3CaO·Al2O3· 3CaSO4·32H2O) and gypsum (CaSO4·2H2O) [9]. The growth of these phases generates internal stresses in the binder, and consequently initiates microcracking and overall concrete deterioration. Besides sulfate attack, concrete structure in the splash zone and above area is also subjected to carbonation and the accelerating effects of wet-dry cycles and other physical attack [10]. The carbonation in marine concrete entails the depletion of portlandite (Ca(OH)2) and the decalcification of C-S-H gel [11]. When chloride-contaminated concrete undergoes carbonation, the chloride penetration will be accelerated simultaneously [12]. Thus, the various deterioration mechanisms mentioned above do not act in isolation. They exhibit synergistic effects, where one form of attack facilitates the initiation and progression of others.
Factors influencing the durability of concrete structures in the marine environment are numerous and can be broadly categorized into the external and internal factors [2]. External factors primarily relate to environmental conditions, including temperature, humidity, ion concentration, carbon dioxide concentration, and other ambient parameters. Furthermore, the deterioration mechanism of concrete is governed by its location. As shown in Figure 1, the tidal zone is subjected to a combination of chemical deterioration from seawater and physical attacks, including freeze-thaw cycles, wet-dry cycles, and splash [2]. The splash attack is able to remove the deterioration products deposits [9]. In comparison, the submerged zone primarily undergoes chemical deterioration, while the atmospheric zone is mainly affected by the salt weathering and carbonation [9]. Without the impacts of freeze-thaw cycles or wet-dry cycles, a relatively slow deterioration rate is commonly identified in the submerged zone and atmospheric zone.
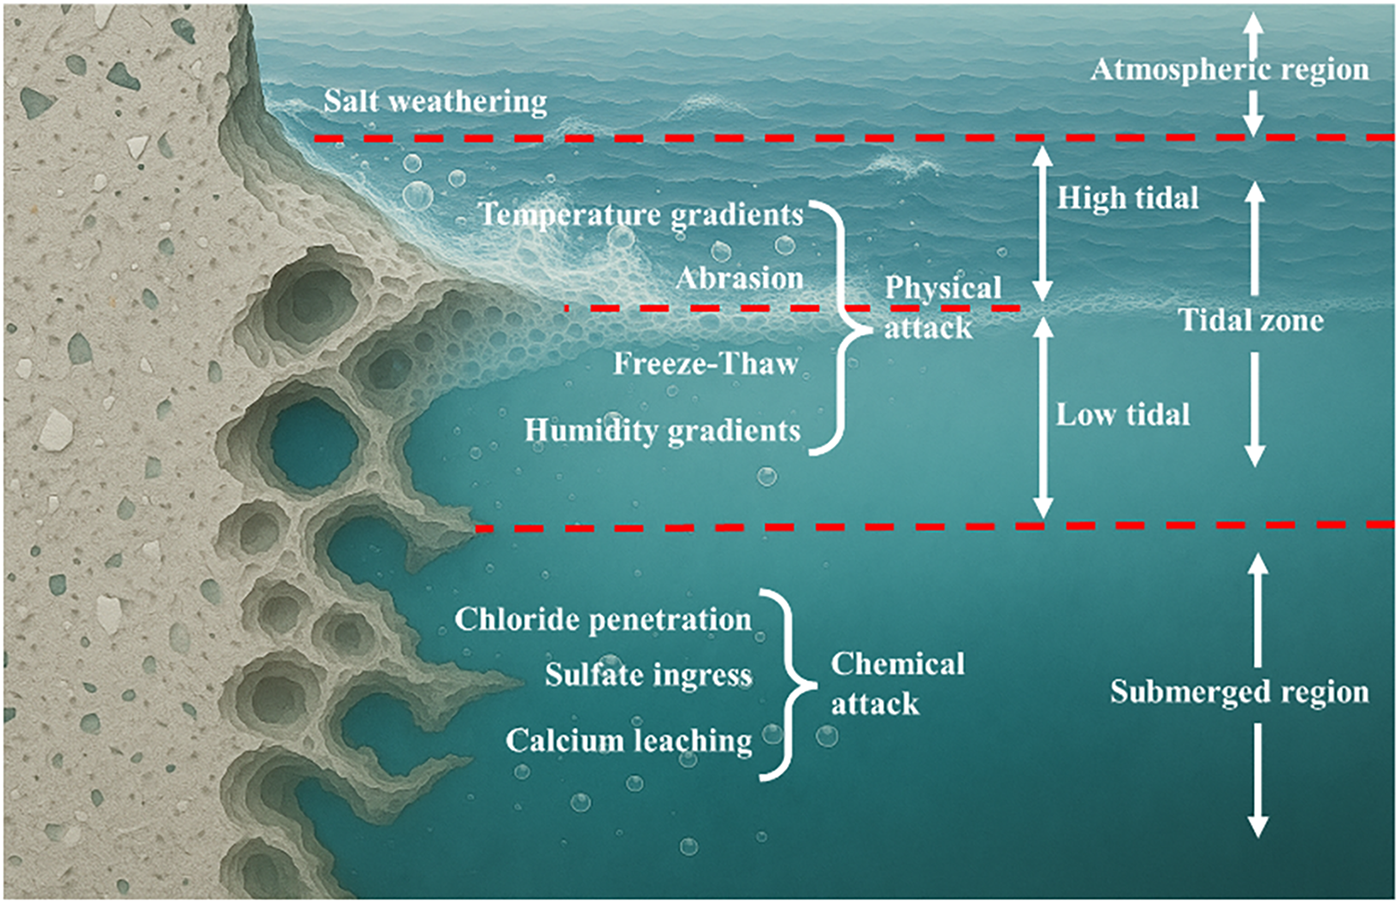
Figure 1 Different exposure zones of concrete structure exposed to the marine environment
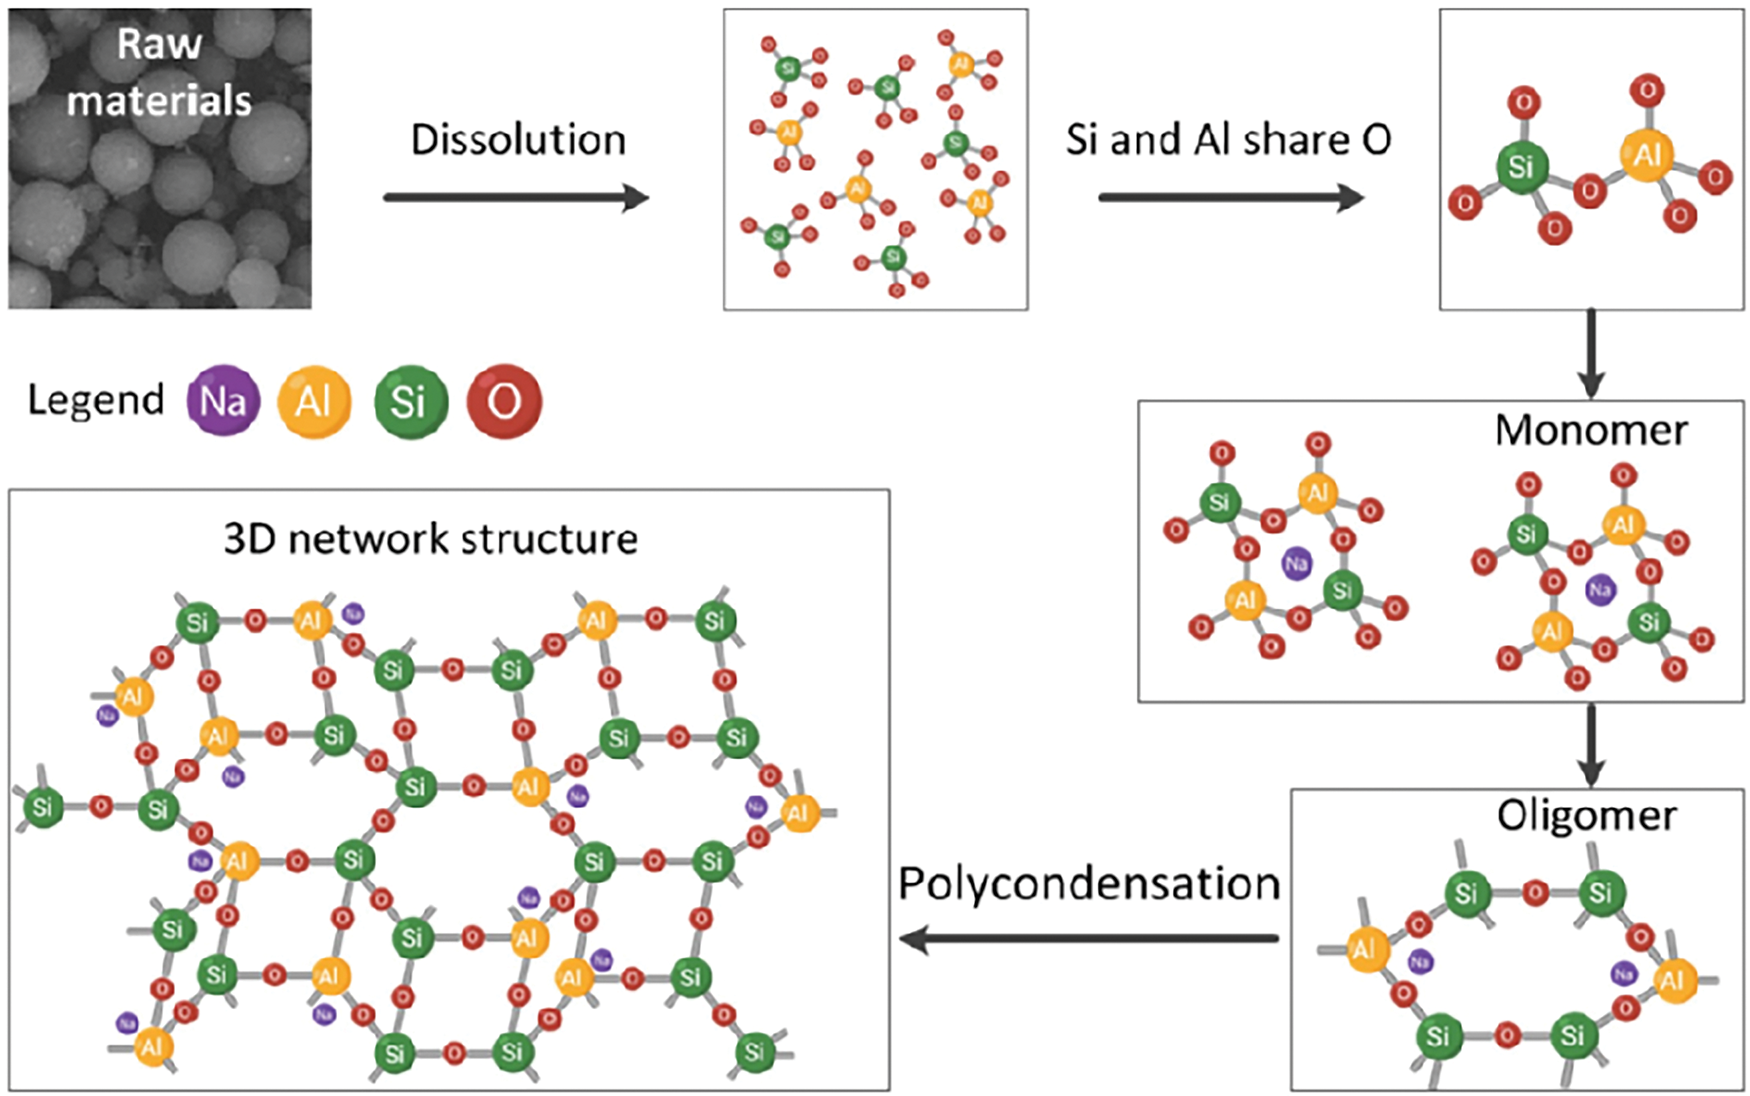
The internal factors include structural design and material properties, among which the type of cement used has become the most significant factor affecting the durability of concrete structures [13, 14]. The pore network within cement binder serves as the primary pathway for the ingress of aggressive agents, making the permeability a governing factor for its long-term durability [15]. Geopolymer, as a novel inorganic cementitious material, is primarily synthesized from silica- and alumina-rich industrial solid wastes combined with activators of sodium hydroxide (NaOH) or sodium silicate solution via alkali activation [16]. The resulting strength-contributing hydration product is sodium-containing calcium aluminium-substituted silicate hydrate (C-(N)-A-S-H) gel phase. Previous studies have widely confirmed that this phase results in a denser pore structure and lower permeability in geopolymer when compared with the ordinary Portland cement (OPC) [17–19]. Provis et al. [18] used X-ray microtomography to analyze the effect of slag content on the pore structure of fly ash-based geopolymer. It was reported that increasing slag content enhanced the pore-filling ability of C-(N)-A-S-H gel phase, and consequently reduced porosity and increased tortuosity. Yang et al. [19] quantitatively analyzed the chloride diffusion rate in fly ash-slag geopolymer using X-ray fluorescence (XRF) technique, and found that the binder with 50% slag content exhibited higher resistance to chloride ingress than that of OPC. Zhang et al. [20] prepared a waterborne epoxy resin-modified metakaolin-based geopolymer as coating for marine concrete, and found that the resin incorporation further enhanced the chloride corrosion resistance. Huang et al. [21] observed that incorporating 20% epoxy resin also notably decreased the chloride permeability and improved resistance to carbonation and sulfate attack. Tian et al. [22] found that incorporating iron tailings into metakaolin-based geopolymer led to a tendency for crystalline fayalite (Fe2SiO4) to transform into iron hydroxide oxide (FeOOH), which further suppressed the chloride ingress. Therefore, the application of geopolymer as cementitious binder has become a well-appreciated approach to prepare dense, impermeable, and durable concrete structure in the marine environment [23].
However, a systematic understanding of the deterioration mechanisms of geopolymer occurring within the complex seawater ion environment has not yet been established. Furthermore, geopolymer in the marine environment is subjected to long-term wet-dry cycles due to tidal and splash, and significant diffraction effects occur when waves interact with the large-scale cylindrical structure. The concrete structure such as dolosse or bridge piers is susceptible to direct wave slapping and frequent cyclic loading from seawater splash. For example, the bridge pier tends to have orthogonal or oblique angles relative to wave direction, thereby amplifying the physical attack from the splash. This process is further intensified during tidal fluctuations due to elevated water levels, as well as the coupled physical-chemical deterioration effects induced by wave splash [9]. Thus, investigating the location-based deterioration mechanisms of specimens under the combined influences of chemical and physical attacks is essential.
This study employed fly ash-slag geopolymer as the research subject. An experimental setup simulating marine splash in the laboratory was applied. After one-year exposure, specimens were sectioned into three parts corresponding to the atmospheric zone, tidal zone, and submerged zone. The atmospheric zone underwent aerial carbonation, the tidal zone faced wet-dry cycles and seawater splashing, and the submerged zone experienced chemical deterioration from seawater, such as the magnesium and sulfate ions attack. X-ray diffractometry (XRD), nitrogen adsorption pore structure analysis, and scanning electron microscope-energy dispersive X-ray spectroscopy (SEM-EDS) were used to characterize the microstructure deterioration. Particular emphasis was placed on the deterioration mechanism in the tidal zone under splash attack.
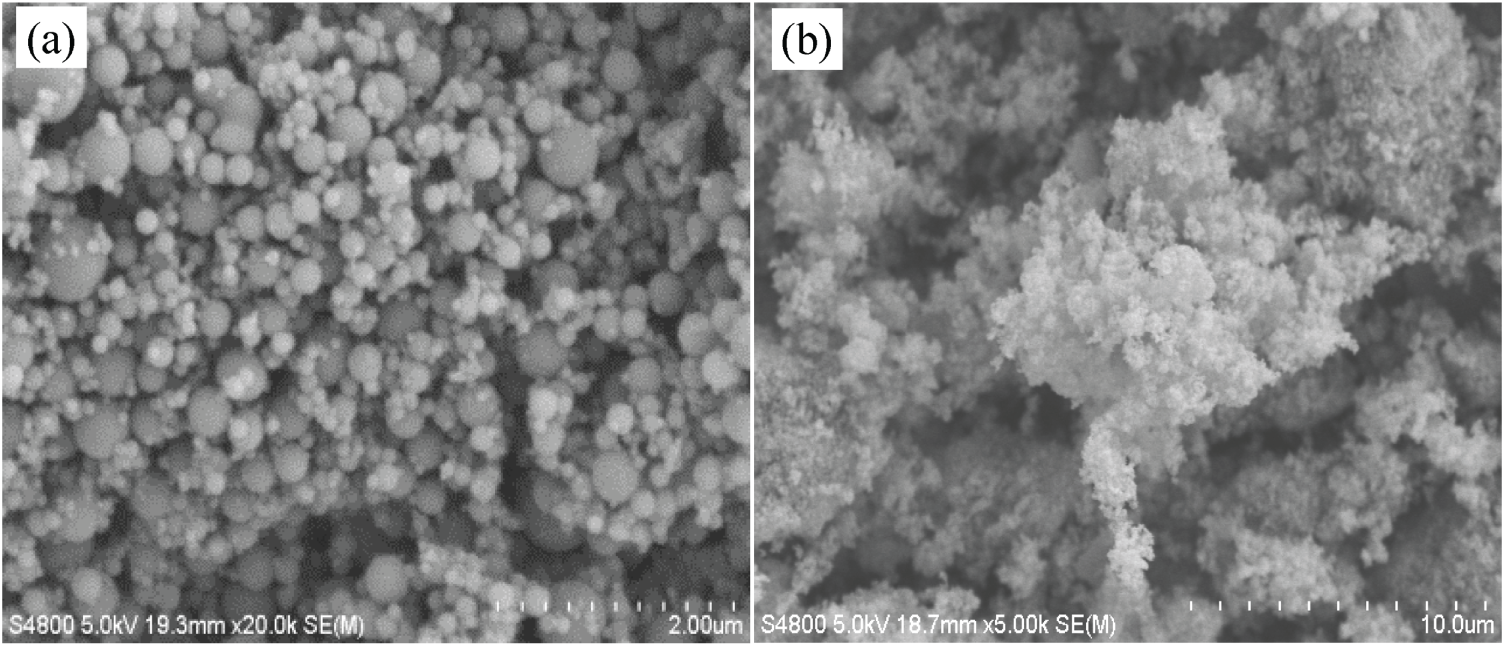
Grade S95 ground granulated blast furnace slag (GBFS) according to GB/T 18046–2017 [24] and Class F-Grade II fly ash (FA) according to GB/T 1596-2017 [25] were obtained from Hailuo Cement Corporation (Wuhu, China), and they were used as the aluminosilicate precursors for preparing geopolymer. The chemical compositions characterized using an ARL-9800 X-ray fluorescence (XRF) instrument (Thermo Scientific) are shown in Table 1. As shown in Figure 2, the cumulative particle volume distribution curves of FA and GBFS were determined by laser diffraction analyzer. The median particle sizes (D50) of FA and GBFS are 14.50 μm and 11.48 μm, respectively. The XRD patterns of FA and GBFS are shown in Figure 3, which are mainly amorphous and also contains traces of crystalline phases of mullite (PDF No. 79-1276, Al2(Al2.8Si1.2)O9.6), quartz (PDF No. 46-1045, SiO2), calcite (PDF No. 05-0586, CaCO3) and åkermanite (PDF No. 74–990, Ca2MgSi2O7).
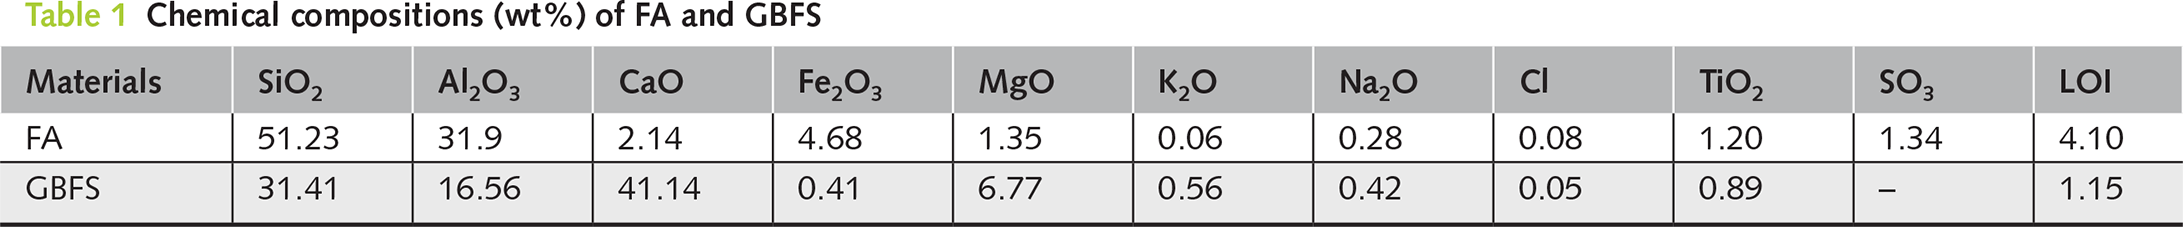
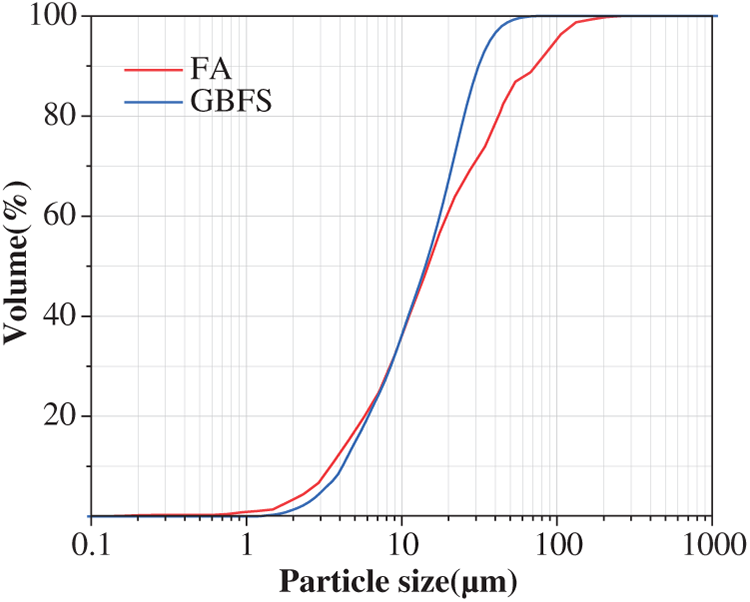
Figure 2 Cumulative particle volume distribution curves of raw materials
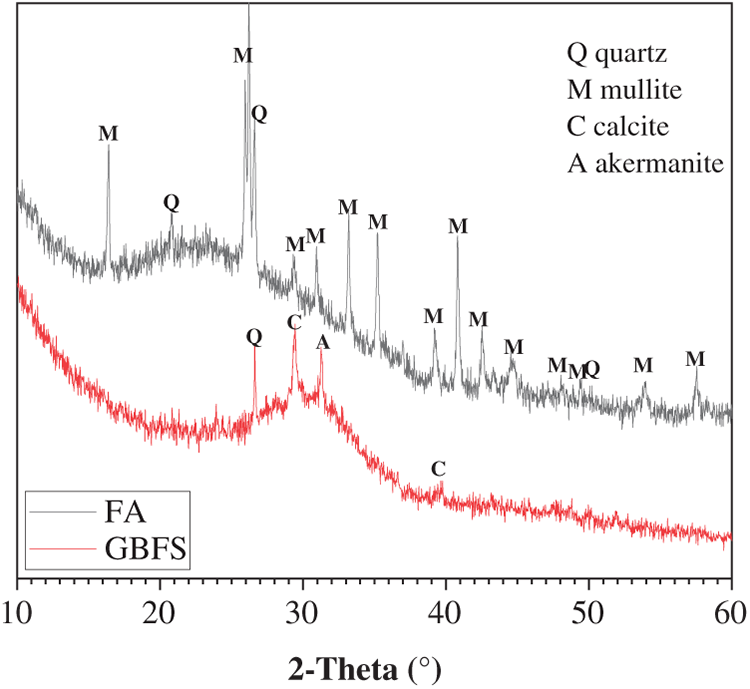
Figure 3 XRD patterns of raw materials
The sodium silicate solution, as the alkaline activator, with 1.4 modulus (molar ratio of SiO2/Na2O) and 30 wt% concentration ((Na2O+SiO2)/(Na2O+ SiO2+H2O)) was prepared by blending NaOH pellets (≥96 wt%), commercial water glass (SiO2 = 30.3 wt%, Na2O = 12.8 wt%) and tap water.
2.2 Laboratory simulation of marine splash
The geopolymer binder was prepared with FA/GBFS ratio of 75%/25% and activator/binder ratio of 0.50. Based on our preliminary experimental findings, incorporating 25% slag could compact the pore structure of the hardened binder, while the activator/binder ratio of 0.5 could achieve adequate workability of the fresh paste for casting [26]. The cylindrical specimens (50 mm diameter × 120 mm height) were prepared and cured in the standard curing chamber (20 ± 1°C, relative humidity ≥ 90%) for 28 days.
Figure 4 presents a top-view photograph, a schematic diagram of the laboratory-constructed setup employed to simulate wave splash in the marine environment, and the sample for SEM characterization. A wave generator was installed at one side of a rectangular tank, with three cylindrical specimens positioned approximately 700 mm away from it to ensure the generation of sufficiently large waves. Artificial seawater, prepared in accordance with ASTM D1141 standard [27], was poured into the tank with the water level aligned to the mid-height of the 120 mm tall cylindrical specimen. The wave generator was subsequently activated, and the seawater was replaced monthly to prevent potential bacterial growth. The wave period was set to 5 s, corresponding to a frequency of 0.2 Hz. The waves had an average height of 15 mm, with a crest-to-trough distance of approximately 30 mm, which perfectly covered the entire tidal zone. The laboratory temperature was controlled as constant as 20°C, and the seawater temperature was recorded as 20 ± 2°C. The specimens experienced for one-year marine splash exposure were used for subsequent examination. For the comparative analysis of marine splash exposure on the microstructure deterioration of geopolymer, a control specimen that underwent one-year standard curing was used as the reference.
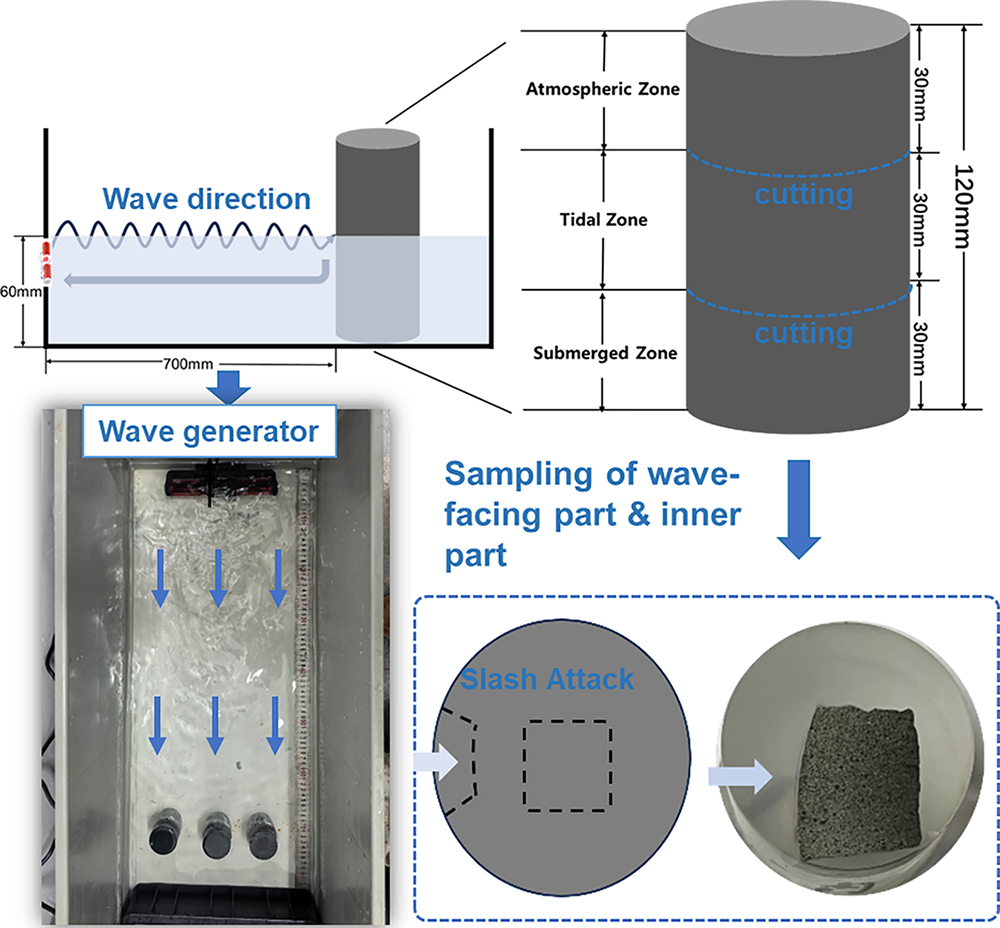
Figure 4 Top-view photograph and schematic diagram of the laboratory-constructed setup employed to simulate wave splash in the marine environment, and the samples extracted from distinct regions for SEM characterization. The red component represents the wave generator, the wavy line represents the direction of wave propagation, and the straight line represents the seawater circulation direction
Based on the position of specimen and environmental exposure within the tank, the cylinder can be divided into three distinct zones: the upper atmospheric zone, the middle tidal zone, and the lower submerged zone, as schematically illustrated in Figure 4. The atmospheric zone was not in direct contact with seawater, but was exposed to the air. It was impacted by the increased ambient humidity and corrosive ions resulting from the seawater evaporation. The tidal zone at the mid-section of cylinder was subjected to continuous wave splash and cyclic wet-dry conditions. This sample experienced alternating contact with both seawater and air, making it susceptible to combined chemical attack from the seawater and physical attack caused by the splashing waves. The submerged zone located at the bottom of cylinder was fully immersed in seawater and isolated from direct air exposure. The primary deterioration mechanism in this zone should be associated with chemical deterioration from the seawater contact.
After one-year exposure to marine splash, three cylindrical specimens were cut and sectioned according to the pre-defined zones (Figure 4). The sectioned samples (50 mm diameter × 30 mm height) were designated as AZ (Atmospheric Zone), TZ (Tidal Zone), and SZ (Submerged Zone) samples. The specimen was cut using a high-speed cutting machine equipped with a diamond blade, with the rotational speed set at 2800 r/min. The sectioned samples exhibited smooth cross-sections and maintained structural integrity. The compressive strength was determined using a WHY-200 Auto Test Compression Machine. Three replicates sectioned according to the same part from three specimens were tested to ensure statistical reliability. As there was no variation in the curing conditions along the height of the control cylindrical specimen, it was sectioned into three parts for the compressive strength testing.
The crushed samples were subsequently ground into powder for X-ray Diffraction (XRD) analysis, which was conducted on a SmartLab 9 kW Rigaku diffractometer to identify the phase assemblage.
For pore structure characterization, particles with a size range of 1–3 mm were collected by sieving. The pore structure was analyzed using a TriStar II 3020 instrument (Micromeritics) via the nitrogen adsorption technique, with data interpreted using the Brunauer-Emmett-Teller (BET) theory.
Regarding SEM sample preparation, as illustrated in Figure 4, particles of approximately 5 mm in size were collected. Particular attention was paid to collecting samples from the wave-facing surface from both the TZ and SZ, also noted as the TZ-out and SZ-out samples. These selected samples were fractured into small, wedge-shaped pieces, mounted in resin, and then polished using sandpaper. Finally, the prepared cross-section area was coated with gold prior to Backscattered Electron (BSE) imaging using Nova Nano-SEM 450 FEI field emission scanning electron microscope.
Figure 5 illustrates the impact of marine splash exposure on the compressive strengths of geopolymer binders. The control specimen, cured under standard conditions for one year, exhibited a compressive strength of 46.7 MPa. In comparison, all specimens subjected to marine splash exposure showed varying degrees of strength loss. The compressive strengths of AZ, TZ, and SZ samples were measured as 31.5 MPa, 24.3 MPa, and 33.9 MPa, corresponding to strength loss rates of 32.5%, 48.0%, and 27.4%, respectively. Notably, the TZ sample experienced the most significant strength loss, which was attributed to the synergistic effect of chemical and physical attack from seawater ingress and wave splashing. This induced the most pronounced deterioration of microstructure. In comparison, the SZ sample exhibited the lowest strength loss rate, suggesting that the singular chemical deterioration without the interference of wet-dry cycles was less severe. Consistent with these findings, Li et al. [13] noted that while geopolymer binder generally possessed high strength and durability, it often suffered from brittleness defects. This inherent brittleness could induce a significant negative impact on strength development in aggressive environments such as splash or tidal zones.
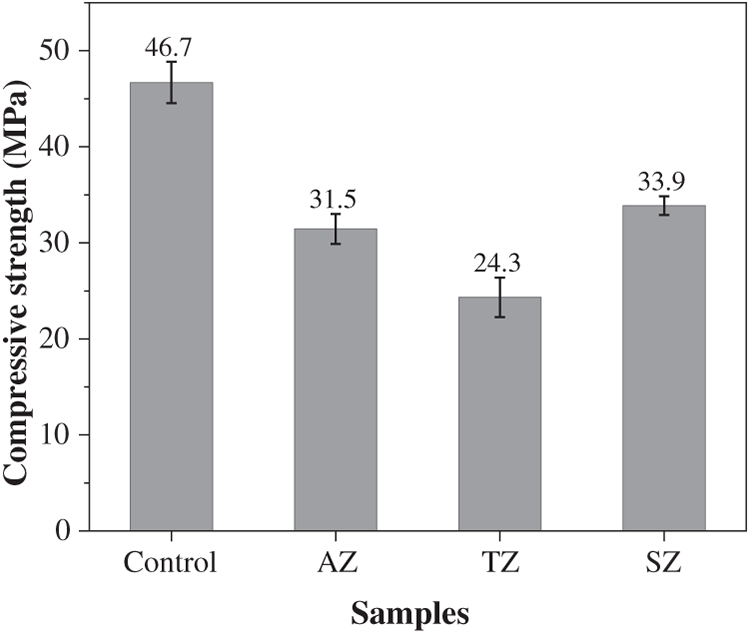
Figure 5 Compressive strengths of geopolymers after one-year standard curing or marine splash exposure
Figure 6 shows the XRD patterns of different zones from the geopolymer cylindrical specimen after one-year marine splash exposure. The variation in exposure zones does not lead to significant phase differences, with no distinct variations observed among the patterns. The main binder gel phase, C-(N)-A-S-H (PDF No. 29–0331, Ca5Si5Al(OH)O17·5H2O), is identified in all the samples as reflected as a diffuse intensity hump centered at around 29° 2θ [28]. The primary crystalline phases, including mullite, quartz, and calcite, originate from the unreacted components present in fly ash and slag. Notably, no apparent difference is observed between the wave-facing surface part (TZ-Out) and inner part (TZ-In) of the TZ sample, suggesting that the deterioration caused by wave splash is predominantly physical in nature.
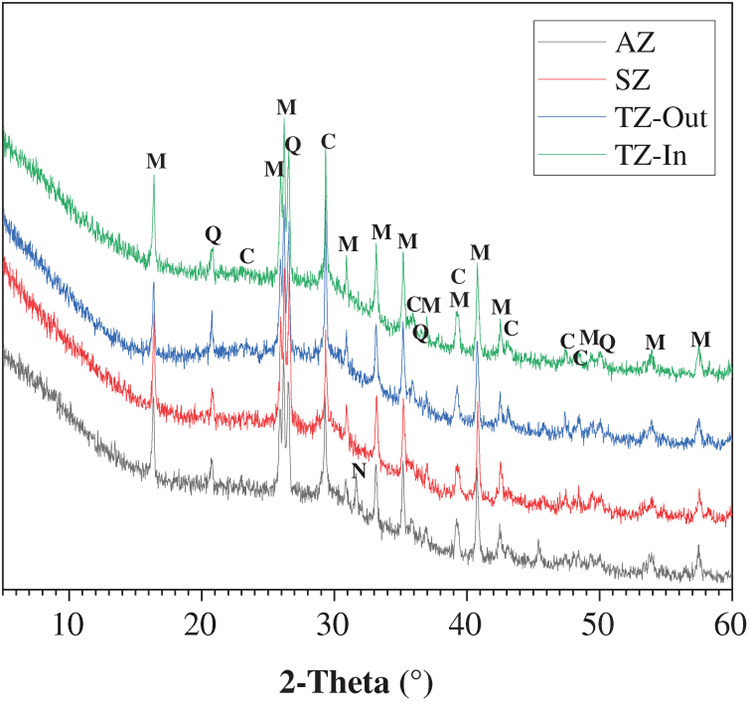
Figure 6 XRD patterns of geopolymers after one-year marine splash exposure
A significant crystalline phase of natron (PDF No. 15-0800, Na2CO3·10H2O) is identified in the AZ sample. This phase is a typical carbonation product found on the surface of geopolymer binder that experienced severe efflorescence [29]. The presence of natron in the AZ sample can be attributed to the specific moisture conditions. While the lower section was immersed in seawater, the upper section remained in contact with air. The evaporation of pore solution in the upper section led to the upward migration of Na+ ions via capillary pressure. These ions subsequently undergo carbonation upon reaction with the atmospheric CO2, leading to the formation of natron in AZ. Consequently, in addition to deterioration by seawater evaporation, the AZ sample also experiences deterioration through efflorescence.
Figure 7 shows the pore structure of geopolymer after one-year marine splash exposure, and the relative parameters are tabulated in Table 2. As revealed by the cumulative pore volume distribution curves in Figure 7a, the TZ sample exhibits the highest cumulative pore volume, while the AZ sample shows the lowest value. The pore volume distribution histogram shown in Figure 7b demonstrates that the pore sizes are predominantly distributed below 100 nm, which can be classified into gel pores (<10 nm) and capillary pores (10–100 nm). The capillary pores are identified as the dominant type. In comparison, our previous research measured the pore structure of standard-cured 40% slag-60% fly ash geopolymer using the nitrogen adsorption technique, and reported that gel pores constituted the major fraction in the cumulative pore volume [30]. This suggests that the marine splash exposure leads to the formation of a less refined pore structure in the binder. Notably, the TZ sample displays a significantly higher volume of capillary pores (0.063 cm3/g) compared to the other two cases (0.050 and 0.055 cm3/g for AZ and SZ samples, respectively), indicating that the marine splash induces the most severe deterioration in it.
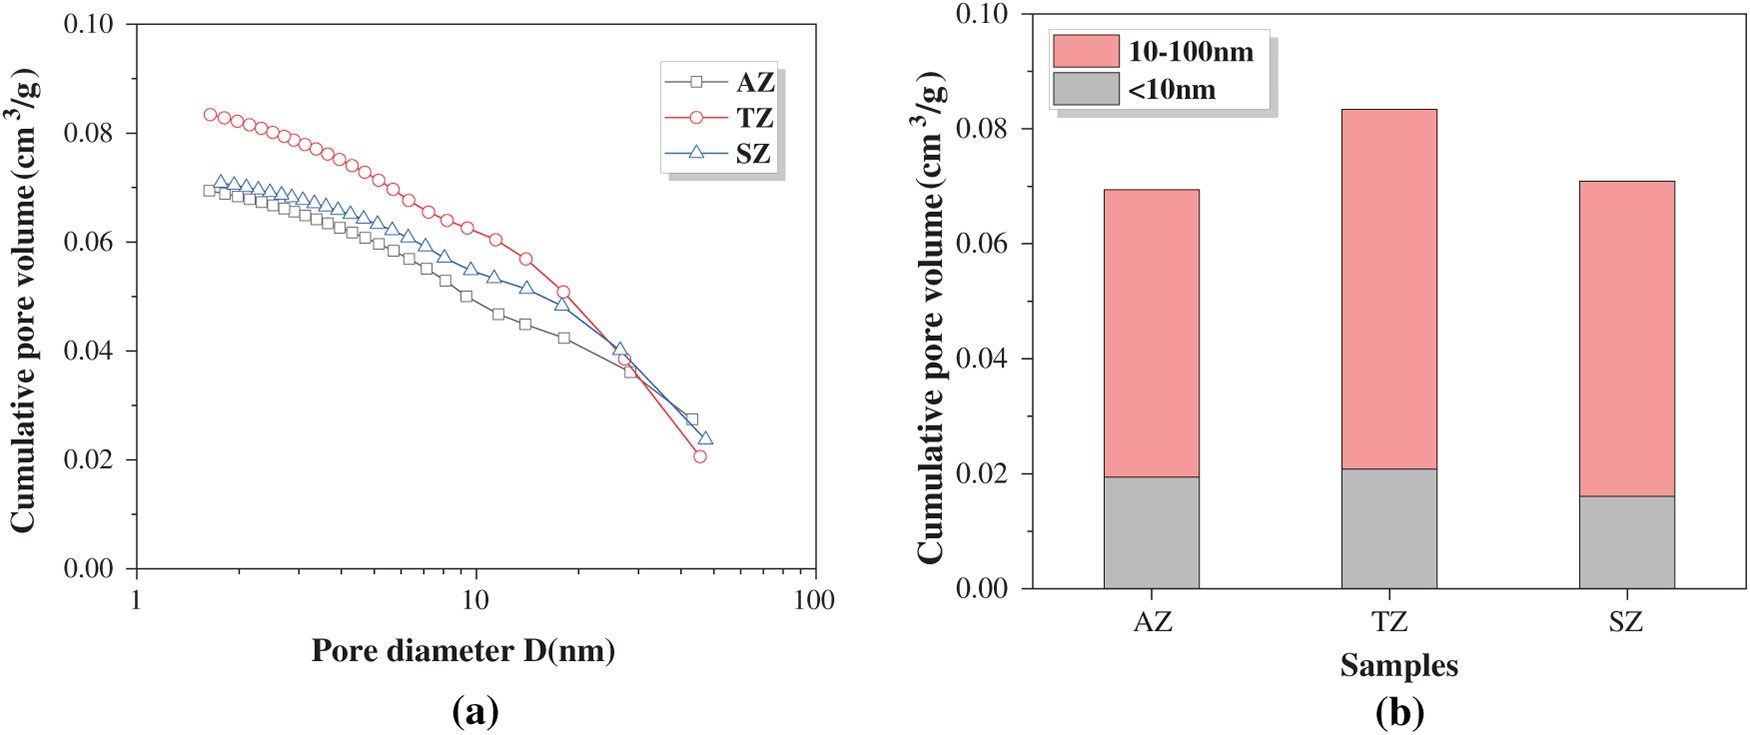
Figure 7 Pore structure analysis of geopolymers after one-year marine splash exposure: (a) cumulative pore volume distribution curves and (b) pore volume distribution histogram
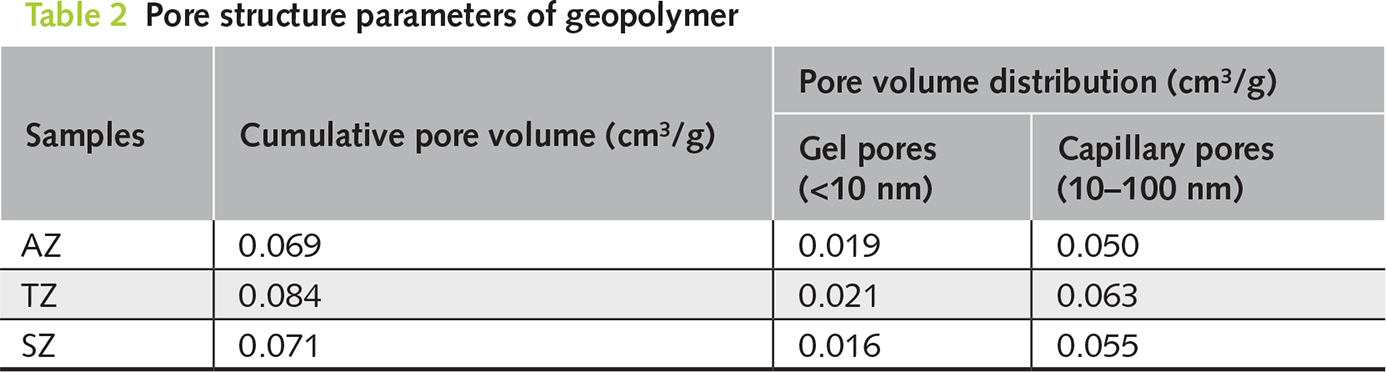
Figure 8 shows the SEM-EDS analysis of the geopolymer after one-year marine splash exposure. As shown in Figure 8a, the BSE image and corresponding EDS mapping analysis of the control specimen exhibit a typical cross-section microstructure of the fly ash-slag geopolymer. Spherical Al-rich fly ash particles and irregular Ca- and Mg-rich slag particles are embedded within the matrix. Distribution of a large amount of Na throughout the matrix indicates that alkali leaching does not occur severely in the control specimen under standard curing conditions. The presence of microcracks in the matrix is mainly due to the internal shrinkage stress developed in the skeleton.
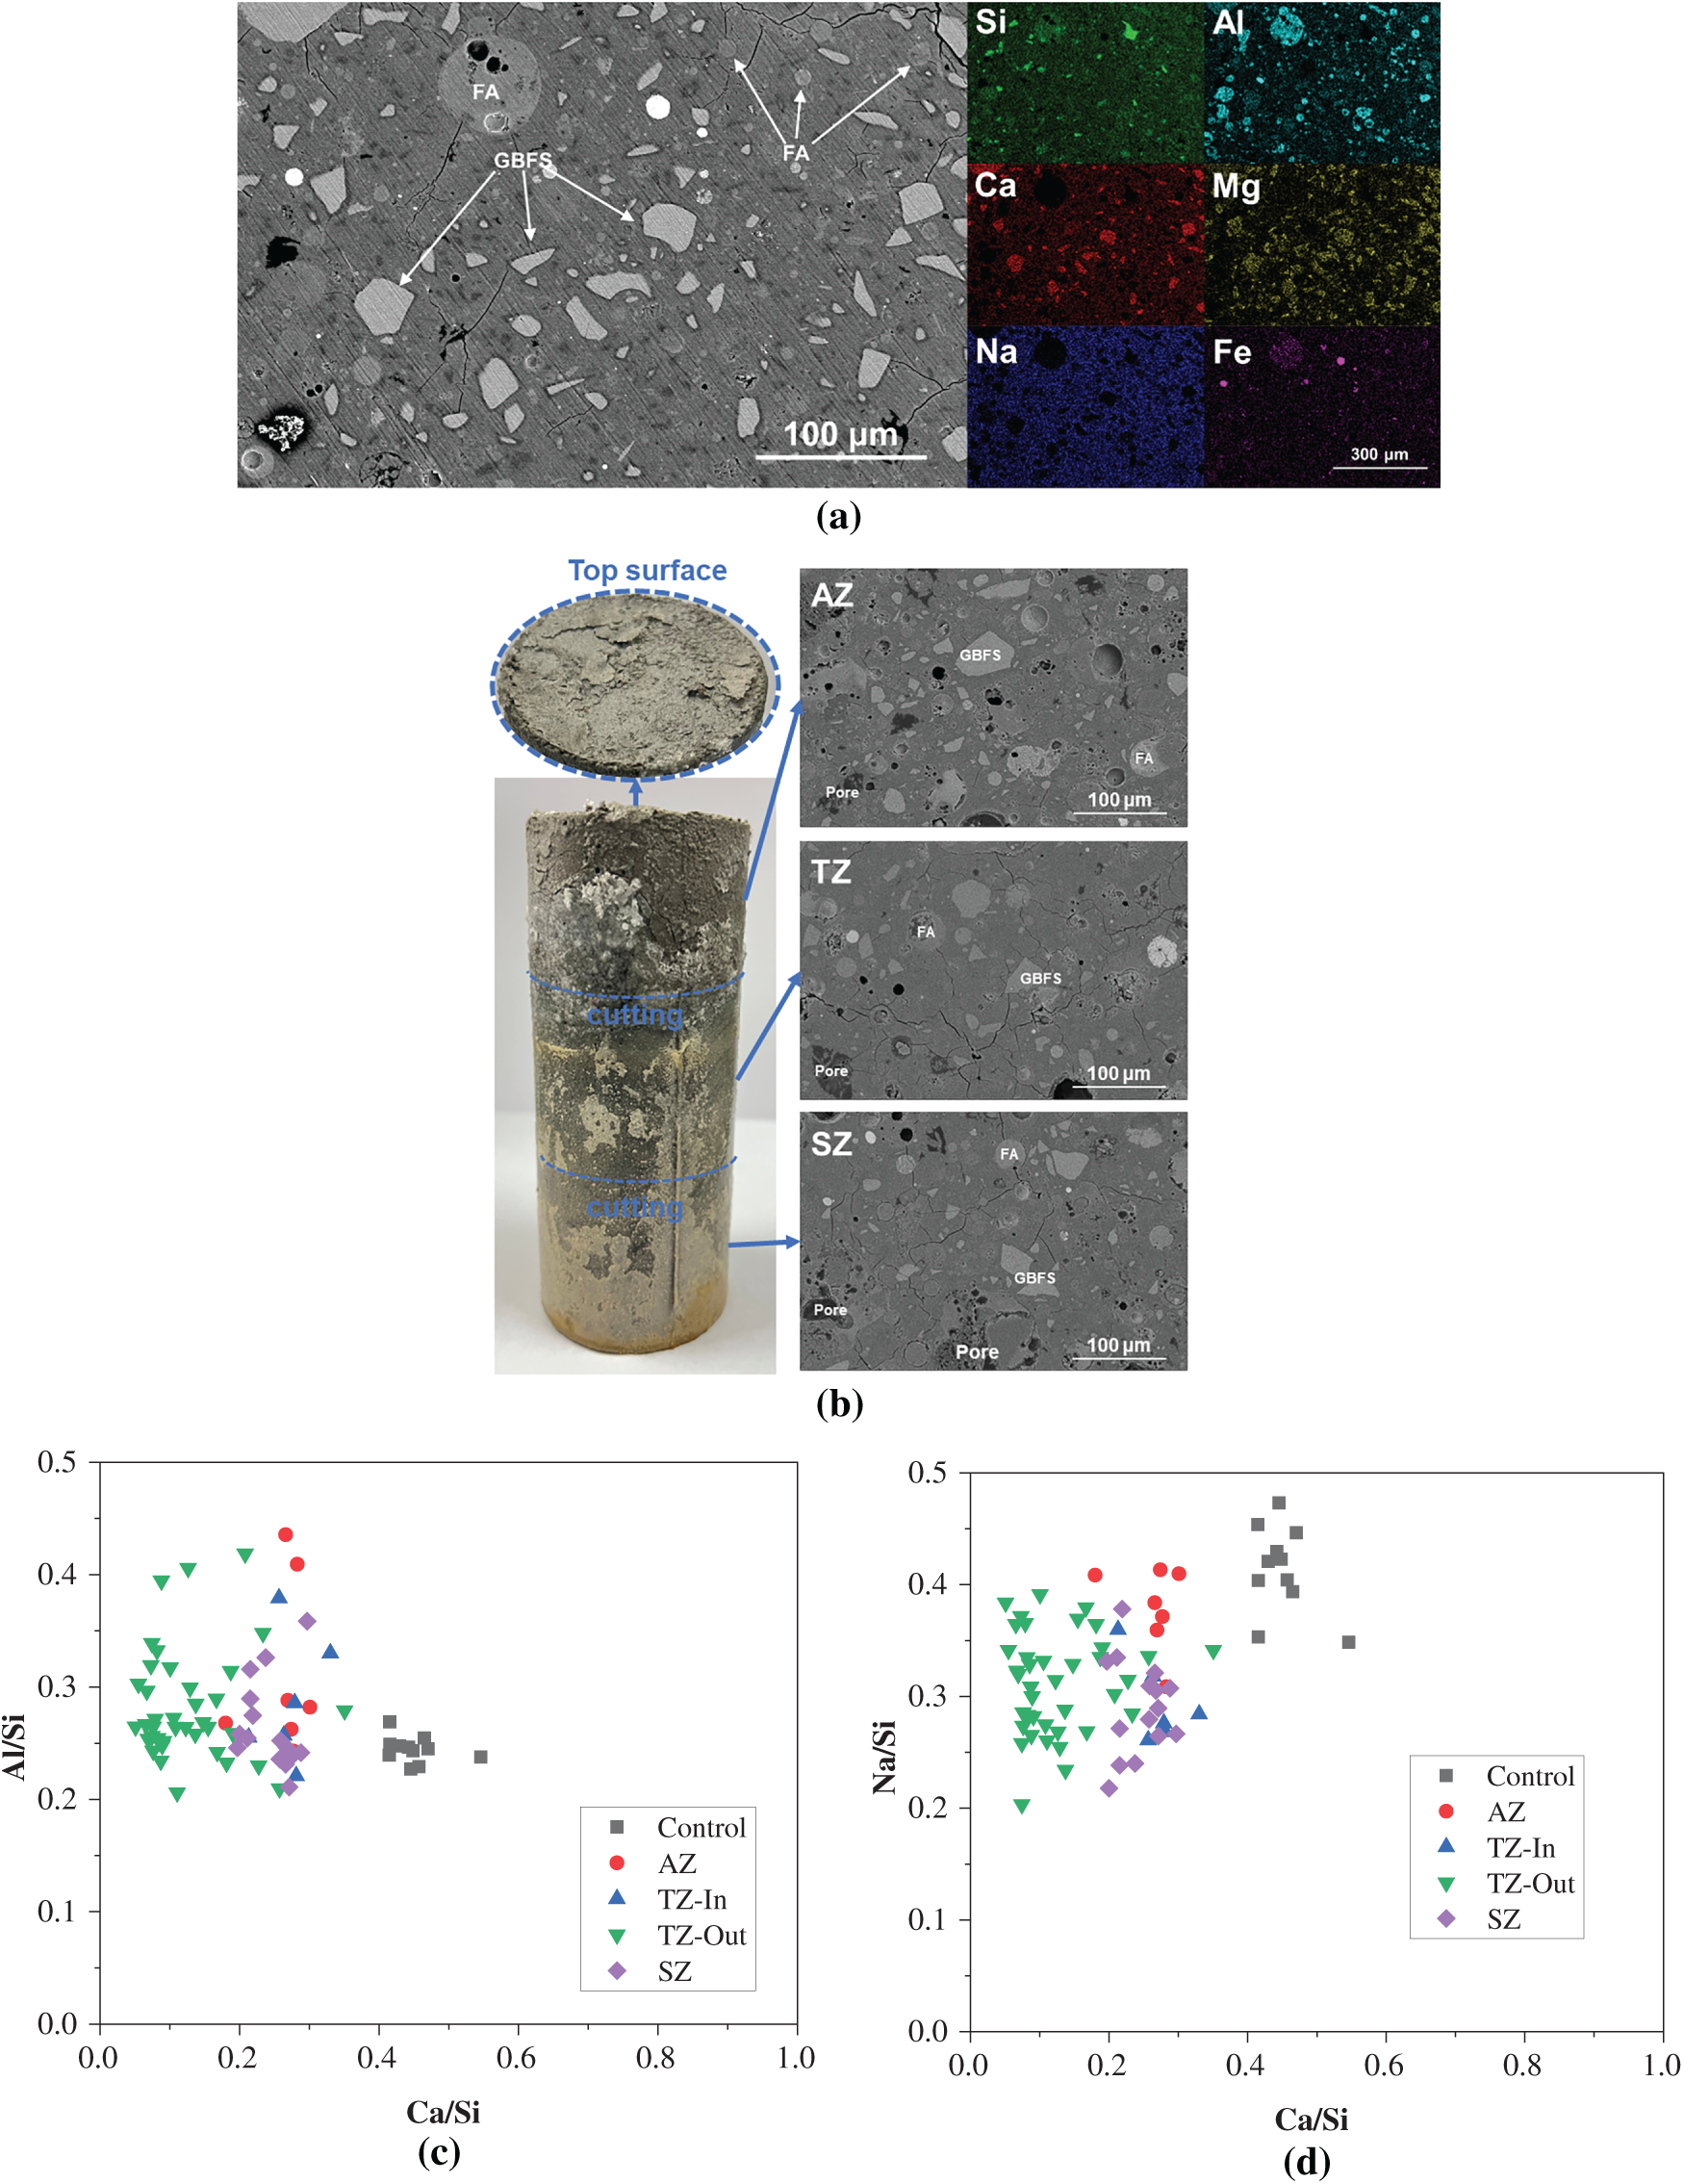
Figure 8 SEM-EDS analysis of the geopolymer: (a) BSE image and EDS mapping analysis of the control specimen after one-year of standard curing; (b) photograph of the specimen after one-year marine splash exposure and BSE images of the inner parts in AZ, TZ and SZ samples; (c) and (d) EDS point scanning statistical analysis of Al/Si versus Ca/Si and Na/Si versus Ca/Si atomic ratios of the C-(N)-A-S-H gel phase formed in the binder
Figure 8b displays a photograph of the specimen after one-year marine splash exposure alongside BSE images of the inner parts obtained from the AZ, TZ, and SZ samples. The side surface of specimen exhibits visible deterioration, with a certain amount of deterioration products deposited on the surface. Crack propagation is observed in AZ and on the top surface, likely attributable to structural deterioration of the hardened paste caused by alkali leaching and efflorescence. A comparison between the BSE images of samples after exposure and that (Figure 8a) of the control specimen reveals no significant microstructural differences, indicating that the one-year marine splash exposure does not cause substantial damage to the internal structure.
Figure 8c,d shows the EDS point scanning statistical analysis of the Al/Si versus Ca/Si and Na/Si versus Ca/Si atomic ratios of the C-(N)-A-S-H gel phase formed in the binder, with the corresponding parameters tabulated in Table 3. The one-year marine splash exposure results in a notable decrease in Ca/Si across all the internal parts distributed in three zones, dropping from 0.45 in the control sample to 0.26, 0.27, and 0.25 in the AZ, TZ, and SZ samples, respectively. This indicates the occurrence of decalcification. In the AZ sample, the decalcification is potentially linked to carbonation-induced loss of Ca2+ ions from the pore solution, also influenced by the alkali leaching and efflorescence [31]. The Ca/Si ratios decrease in both the TZ and SZ samples can be attributed to decalcification of the C-(N)-A-S-H gel phase driven by the ingress of Mg2+ and SO42− ions from seawater [32]. Notably, the Ca/Si ratio in the outer layer of TZ as the wave-facing surface decreases significantly to 0.13, suggesting identification of the most severe decalcification due to the combined effects of atmospheric carbonation and seawater attack [10]. In comparison, the Al/Si ratios remain relatively consistent across all samples, with no marked changes induced by seawater exposure. The Na/Si ratios exhibit pronounced decline from 0.41 in the control sample to 0.38, 0.29, and 0.29 in the internal AZ, TZ, and SZ samples, respectively. This also indicates to the varying degrees of alkali leaching or carbonation. The more substantial reductions of Na/Si ratios in the TZ and SZ samples confirm that the alkali leaching is most pronounced in the zones directly exposed to seawater [14].
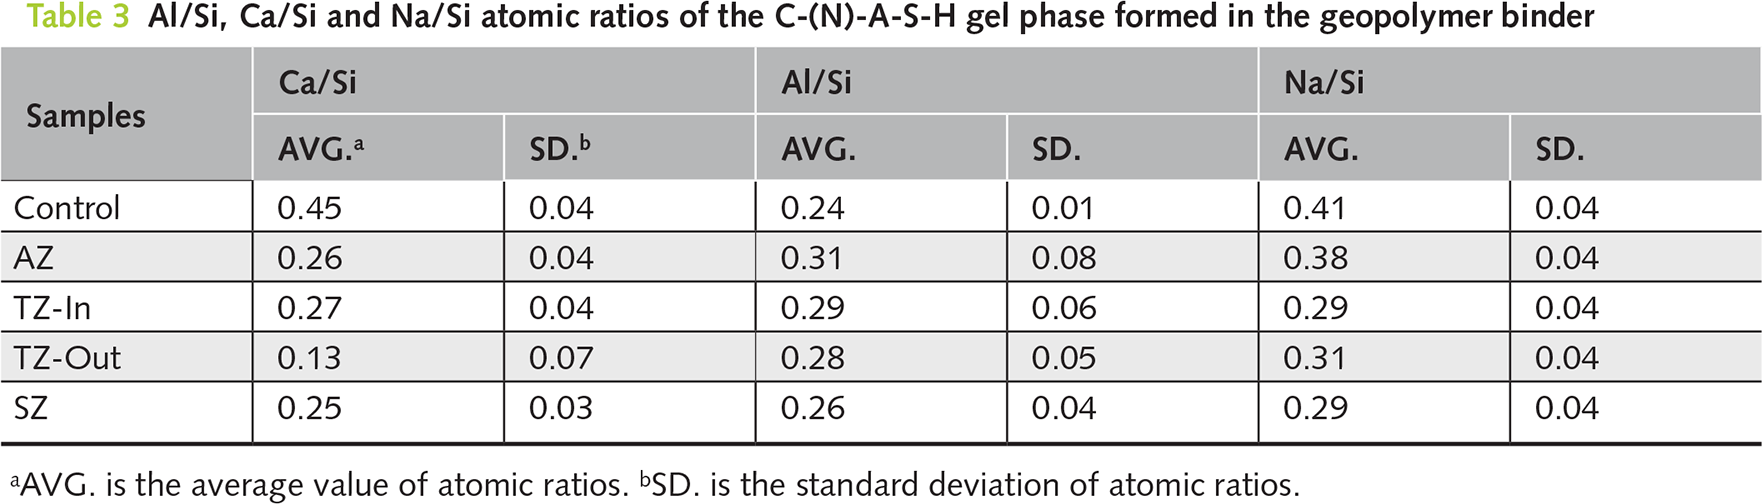
Figure 9 presents the BSE image and EDS mapping results of the TZ-Out and SZ-Out samples. As shown in Figure 9a, a thin layer of calcium carbonate products is formed on the surface of the TZ-out sample. Although the contents of Si and Al in the matrix are not significantly affected, notable decalcification and Mg2+ ion ingress are identified. This indicates that the wave-facing surface of TZ intermittently contacts seawater due to wave action and experiences gradual ingress of Mg2+ ions in the matrix. However, no Mg-rich product layer is formed on the surface. The carbonation induced by air exposure is identified as one of the primary reasons for decalcification [10].
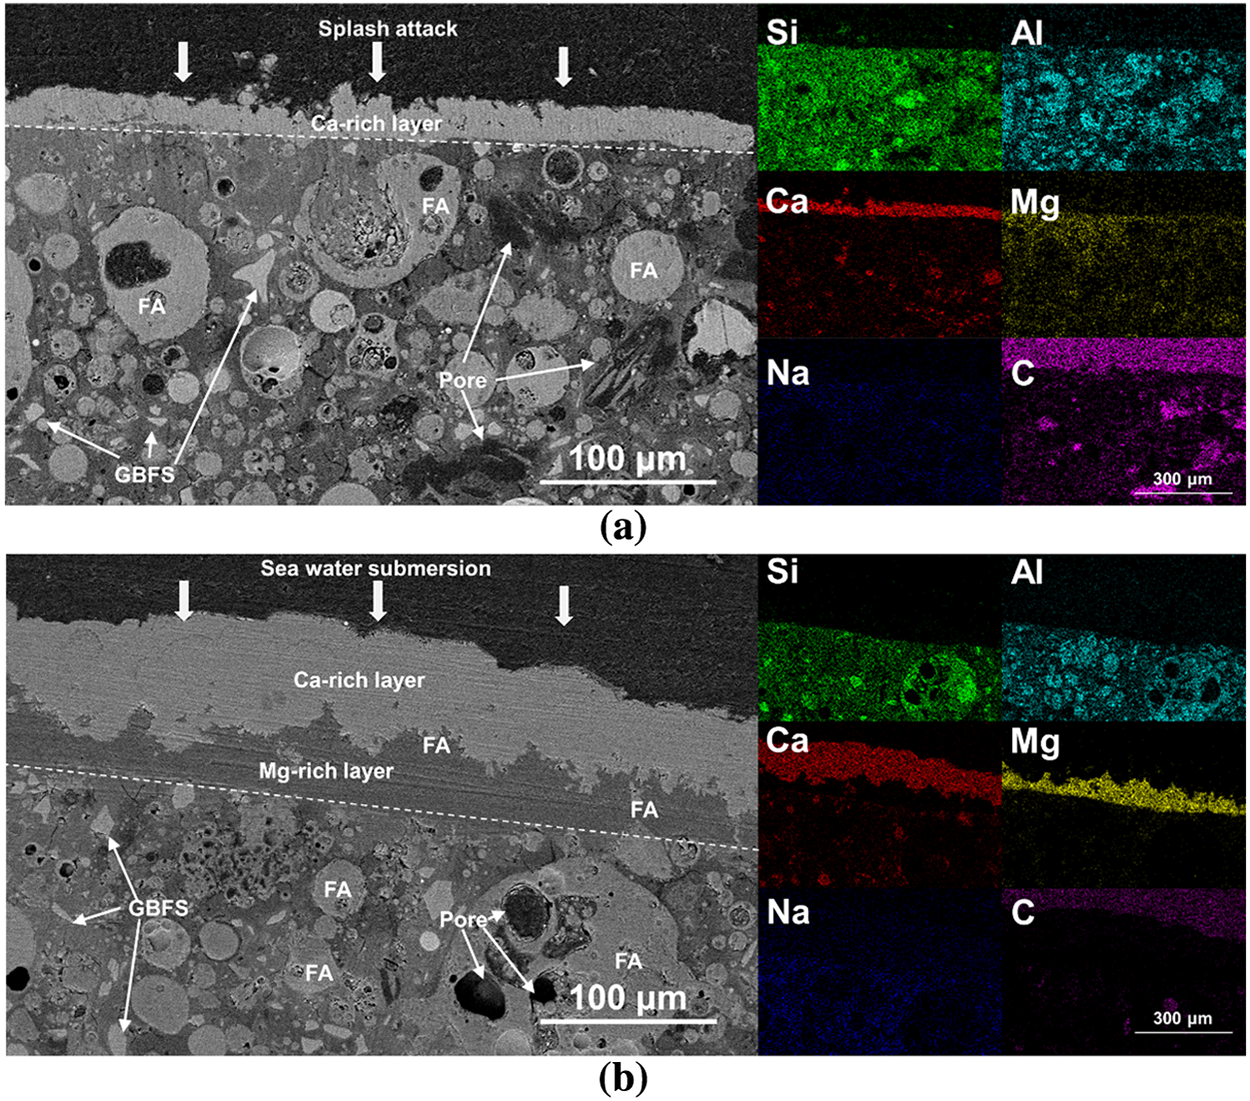
Figure 9 BSE image and EDS mapping test of the (a) TZ-out and (b) SZ-out samples. The carbonization product layer and the matrix are separated by a white dotted line
In comparison, as illustrated in Figure 9b, a thicker carbonation product layer is formed on the surface of the SZ-Out sample, which exhibits a two-layer structure including an outer calcium carbonate layer and an inner magnesium carbonate layer, separated by a distinct interface. After the prolonged seawater exposure, infiltrated Mg2+ ions induce the formation of Mg(OH)2 in the pore solution of binder, which reduces the alkalinity of the pore solution and subsequently accelerates the decalcification of C-(N)-A-S-H gel phase [33]. The following carbonation of Mg(OH)2 leads to the formation of magnesium carbonate layer between the calcium carbonate layer and the matrix.
To further investigate the phase distribution in the TZ-Out and SZ-Out samples, two additional regions were selected for the BSE testing, and EDS point analysis was conducted from the surface to the interior matrix. The results are shown in Figure 10 and Table 4. The obtained results are consistent with the analysis of microstructural deterioration as discussed above. Figure 11 illustrates a schematic diagram of the seawater deterioration process for the geopolymer. In the TZ-Out sample, calcium carbonate is deposited on the surface (Point 1#), while the interior (Points 2/3/4#) is mainly composed of the decalcified matrix, indicating that decalcification progresses from the exterior inward. Additionally, the presence of certain amounts of magnesium within the matrix suggests the ingress of Mg2+ ions from seawater. In the SZ-Out sample, the surface carbonation products (Points 5/6/7#) are composed of calcium carbonate and magnesium carbonate, arranged in closely adjacent layers. Meanwhile, the inner matrix (Point 8#) exhibits significant decalcification, while the Mg content in the matrix is lower than that in the TZ-Out sample. This indicates that under the SZ conditions without wet-dry cycles and splash-induced physical damage, the seawater immersion curing induces a lower rate of Mg2+ ion ingress.
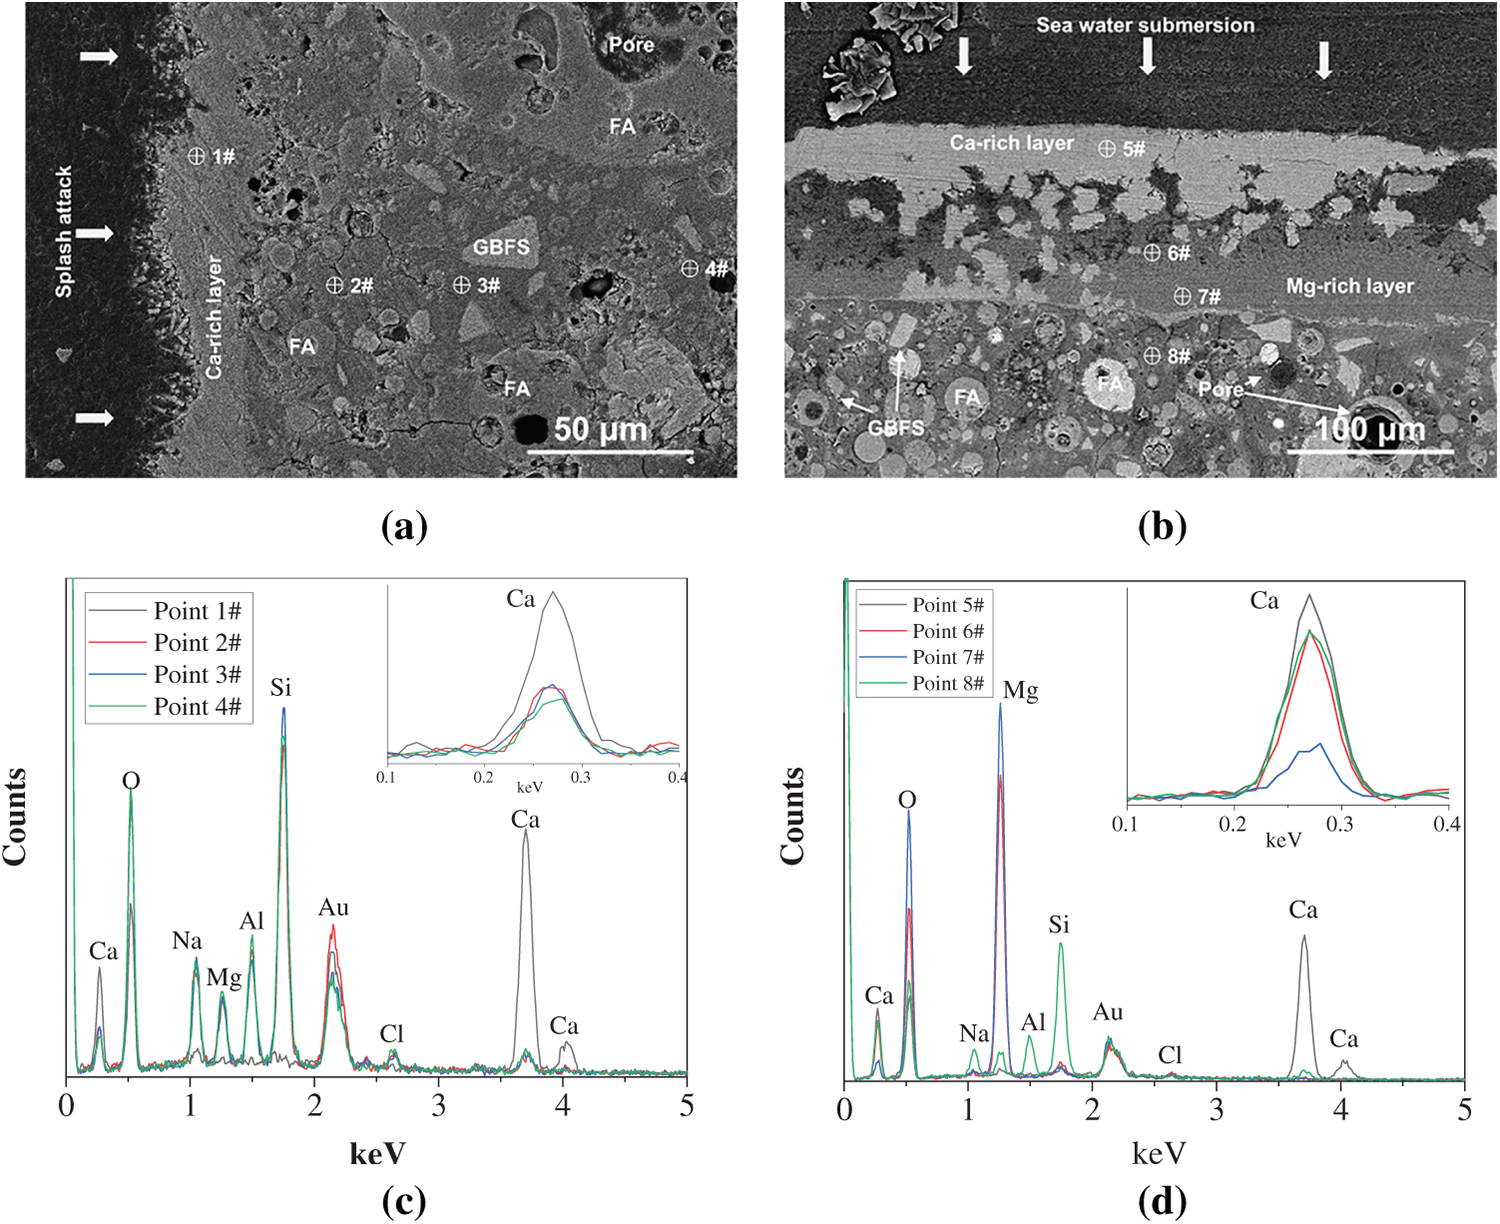
Figure 10 SEM-EDS analysis of the geopolymer after one-year marine splash exposure: (a,b) BSE images and (c,d) EDS point scanning analysis of TZ-Out and SZ-Out samples
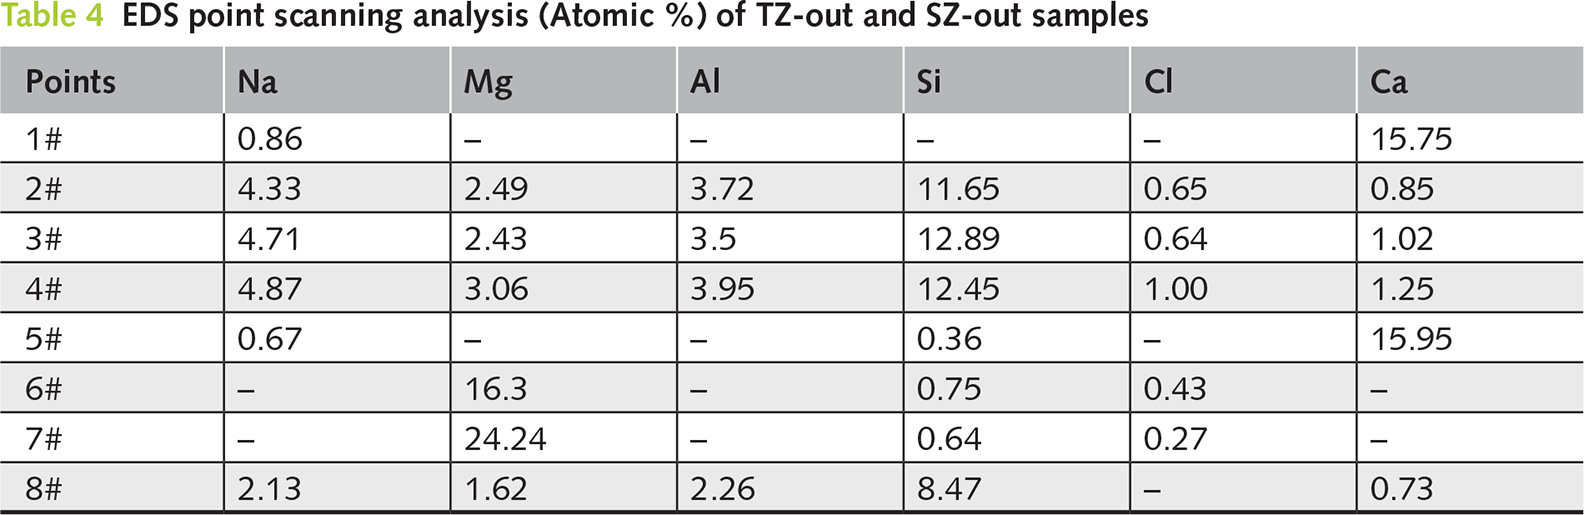
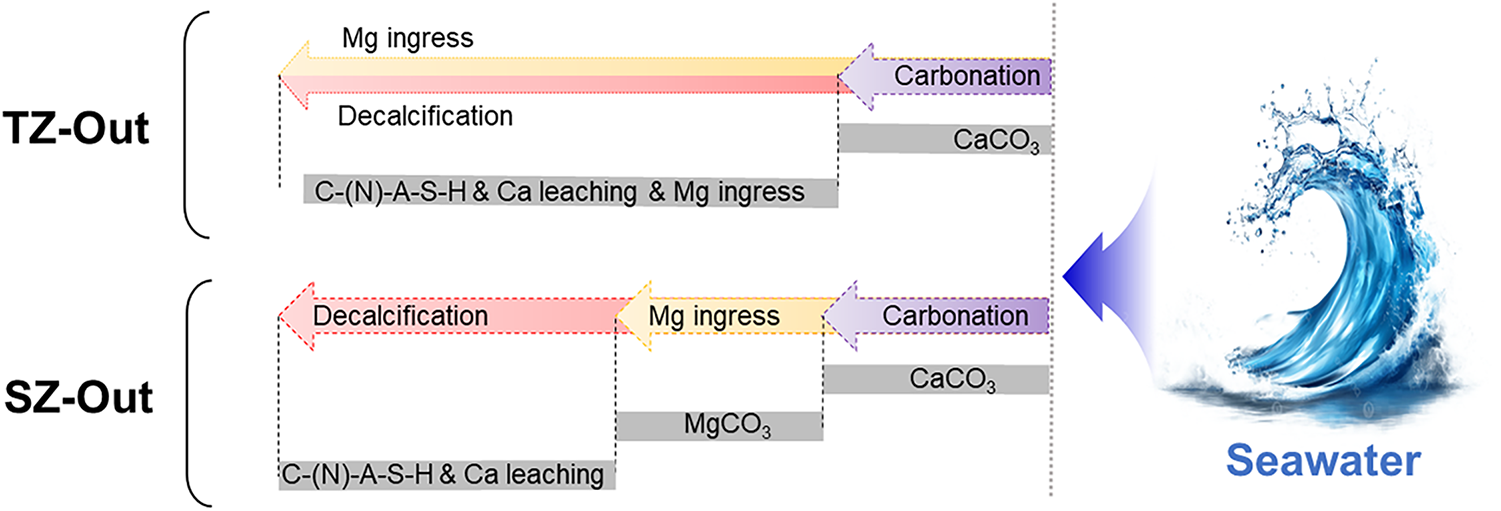
Figure 11 Schematic diagram of the TZ-Out and SZ-Out samples
Additionally, it is noteworthy that the matrix in both TZ-Out and SZ-Out samples does not contain sulfur, without detecting the sulfate attack from seawater. This observation can be explained by two factors: first, the relatively dense carbonation product layer formed on the surface may inhibit the ingress of aggressive sulfate ions from seawater; second, the deterioration process may be slow, and the one-year experimental duration may be insufficient to reveal the notable ionic damage.
After one year of marine splash exposure, the fly ash-slag geopolymer specimen was divided into three zones, including atmospheric zone (AZ), tidal zone (TZ), and submerged zone (SZ), and the microstructure was investigated. The results are summarized as follows:
(1) The TZ sample exhibits the lowest compressive strength of 24.3 MPa, representing a strength loss rate of 48.0% compared to the control one. This indicates that the TZ sample experiences the most severe deterioration due to the combined effects of physical impact from wave splash and wet-dry cycles, and chemical attack from seawater. Pore structure analysis further reveals that the TZ sample has the highest cumulative pore volume, with a notable increase in the proportion of capillary pores.
(2) The decalcification of C-(N)-A-S-H gel reduces the Ca/Si ratio, while no significant phase or microstructural changes are observed in the interior part of the geopolymer after exposure. Visible deposits are formed on the side surface of the specimen, accompanied by crack propagation at the top surface. A calcium carbonate layer is formed on the wave-facing surface of TZ sample, along with decalcification and Mg ingress in the binder. In comparison, densely bonded and sequential layers of calcium and magnesium carbonate are formed on the surface of SZ sample. The Mg2+ ions ingress in the SZ sample proceeds at a relatively lower rate than that of TZ sample.
This study provides insights into the structural deterioration processes of different sections in geopolymer specimens after marine splash exposure. However, several limitations should be acknowledged. First, only a single geopolymer formulation was investigated, and thus the effects of critical parameters, such as the fly ash/slag ratio and the compositions of alkaline activator, remain unexamined. Furthermore, the one-year exposure period is relatively short, which needs to be prolonged to enhance the objectivity of the data. The laboratory-simulated environments are simplified and lack the complexity of real-world marine conditions. Furthermore, since the microstructural deterioration is limited to a near-surface region of approximately 100 μm, it could only be characterized by SEM technique with the statistical EDS analysis. However, primarily due to the sampling difficulties, the lack of complementary data from techniques such as XRD and TG hinders a more conclusive analysis of the microstructure deterioration mechanisms. Therefore, future work should address these aspects to further refine the experimental methodology.
Acknowledgement
The financial support from National Natural Science Foundation of China (52502034), the Funding for school-level research projects of Yancheng Institute of Technology (No. xjr2023025), and the Graduate Research and Innovation Projects of Jiangsu Province (KYCX24_XZ006, KYCX24_XZ048).
Funding Statement
This research was funded by National Natural Science Foundation of China (52502034), the Funding for school-level research projects of Yancheng Institute of Technology (No. xjr2023025), and the Graduate Research and Innovation Projects of Jiangsu Province (KYCX24_XZ006, KYCX24_XZ048).
Author Contributions
The authors confirm contribution to the paper as follows: Conceptualization, Tao Yang; methodology, Tao Yang and Xiang Li; validation, Xiang Li and Wen Chen; formal analysis, Tao Yang and Xiang Li; investigation, Tao Yang and Xiang Li; data curation, Xiang Li, Wen Chen, Zikang Zhang, Hao Ji and Xuelong Qin; writing—original draft preparation, Tao Yang and Xiang Li; writing—review and editing, Tao Yang and Xuan Gao; visualization, Xiang Li and Wen Chen; supervision, Tao Yang and Xuan Gao; project administration, Tao Yang; funding acquisition, Tao Yang. All authors reviewed the results and approved the final version of the manuscript.
Availability of Data and Materials
The data that support the findings of this study are available from the Corresponding Author, [Tao Yang], upon reasonable request.
Ethics Approval
Not applicable.
Conflicts of Interest
The authors declare no conflicts of interest to report regarding the present study.